School Bus Market Analysis from Jan. to Jul. of 2013
Date:2013-08-26 Source:www.chinaspv.com
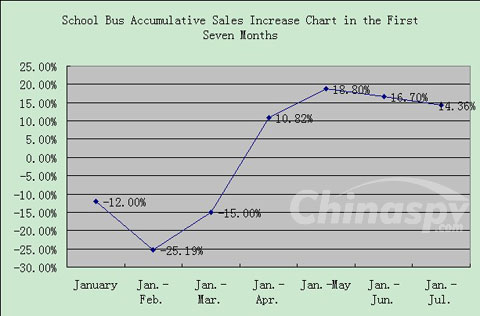
www.chinaspv.com: Feature 1, Increase in the first three months is negative which turns to positive in the latter four months. The biggest decline and increase respectively happens in Jan.—Feb. and Jan.—May. Increase after May slows down.
| Month |
Jan. |
Jan.-Feb. |
Jan.-Mar. |
Jan.-Apr. |
Jan.-May |
Jan.-Jun. |
Jan.-Jul. |
| Year-on-year Increase % |
-12.0 |
-25.19 |
-15.0 |
10.82 |
18.8 |
16.7 |
14.36 |

Reasons of decreasing increase after May are as follows:
1. National macro economy slows down its growth after May which would definitely influence all industries.
2. School bus purchasers mainly depend on governmental funds. Slowing national economic increase would have conducting effect over school bus market increase.
3. Most of schools start their summer holidays after June which turn to official summer holidays in July. Thus, school bus purchasing season and period are both influenced, which objectively limits school bus market increase in the time. As a consequence, school bus sales slow down its increase speed after May.
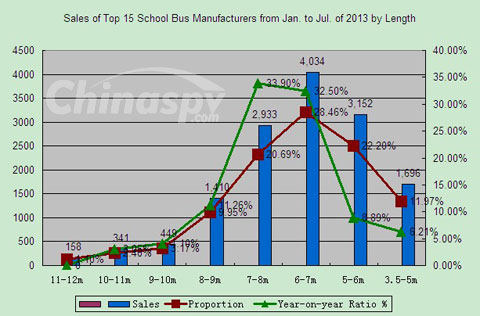
Feature 2, Yutong Bus is still No.1 by sales, but, with a 9.54% decline of market share. Level of sales concentration by top 15 school bus enterprises is slightly weakening. The largest sales volume belongs to 6-7m bus. Meanwhile, the biggest proportions of decline and increase are respectively 7-8m and 5-6m.
According to data of 50 major bus manufacturers, total sales volume of school bus from Jan. to Jul. is 15,000 units increasing almost 14.36% than 13,117 units of 2012. Sales volume by top 15 enterprises is 14,173 units taking up 94.48%. This market share by top 15 reduces 0.4% than Jan. to June. Detailed sales volumes of top 15 enterprises are as follows:
Sales of Major School Bus Manufacturers from Jan. to Jul. of 2012 and 2013 (Unit)
| Enterprise |
Yutong Bus |
Changan Bus |
Quick Bus |
Zhongtong Bus |
Xiangfan Touring Vehicle |
Dongfeng Special Vehicle |
Shangrao Bus |
Yantai Shuchi |
| In Total |
3,184 |
2,518 |
1,852 |
1,541 |
1,173 |
918 |
530 |
486 |
| >12m |
0 |
0 |
0 |
0 |
0 |
0 |
0 |
|
| 11-12m |
67 |
0 |
0 |
0 |
0 |
0 |
0 |
0 |
| 10-11m |
242 |
0 |
0 |
42 |
0 |
0 |
0 |
0 |
| 9-10m |
76 |
131 |
0 |
96 |
30 |
0 |
30 |
0 |
| 8-9m |
681 |
53 |
58 |
123 |
101 |
0 |
102 |
153 |
| 7-8m |
811 |
306 |
2 |
118 |
198 |
320 |
44 |
235 |
| 6-7m |
491 |
885 |
96 |
1,162 |
161 |
598 |
68 |
97 |
| 5-6m |
816 |
4,143 |
0 |
|
683 |
|
286 |
1 |
| 3.5-5m |
|
|
1,696 |
|
|
|
|
|
| Enterprise |
Higer Bus |
KingLong Bus |
Shaolin Bus |
Golden Dragon Bus |
Dongfeng Bus |
Huanghai Bus |
Sunlong Bus |
JAC Bus |
| In Total |
454 |
326 |
308 |
276 |
177 |
159 |
150 |
121 |
| >12m |
0 |
0 |
0 |
0 |
0 |
0 |
0 |
|
| 11-12m |
91 |
0 |
0 |
0 |
0 |
0 |
0 |
0 |
| 10-11m |
25 |
0 |
0 |
32 |
0 |
0 |
0 |
0 |
| 9-10m |
0 |
31 |
0 |
55 |
0 |
0 |
0 |
0 |
| 8-9m |
19 |
0 |
19 |
0 |
0 |
42 |
45 |
14 |
| 7-8m |
203 |
190 |
105 |
108 |
75 |
117 |
98 |
3 |
| 6-7m |
0 |
105 |
184 |
0 |
76 |
|
7 |
104 |
| 5-6m |
116 |
|
|
81 |
26 |
|
|
|
| 3.5-5m |
|
|
|
|
|
|
|
|
Sales of Top 15 School Bus Manufacturers from Jan. to Jul. of 2013 by Length
| Length Range |
11-12m |
10-11m |
9-10m |
8-9m |
7-8m |
6-7m |
5-6m |
3.5-5m |
In Total |
| Sales (Unit) |
158 |
341 |
449 |
1,410 |
2,933 |
4,034 |
3,152 |
1,696 |
14,173 |
| Proportion (%) |
1.1 |
2.4 |
3.17 |
9.95 |
20.69 |
28.46 |
22.2 |
11.97 |
100 |
| Year-on-year Proportion (%) |
0 |
3.05 |
4.10 |
11.26 |
33.9 |
32.5 |
8.89 |
6.21 |
100 |

From the chart above we can see that:
1. School bus sales volumes exceeding 1,000 units from Jan. to Jul. of 2013 belong to five manufacturers, including Yutong Bus, Changan Bus, Quick Bus, Zhongtong Bus and Dongfeng Xiangfan Touring Vehicle. Among these five, Yutong Bus takes up 21.22% market share by its sales volume of 3,184 units ranking No.1. However, it still reduces 9.54% compared with 30.76% of 2012.
2. From the sales of top 15 bus enterprises, 6-7m takes up 28.46% market share followed by 5-6m with its 22.2% market share. The third is 7-8m taking up 20.69% market share. The last one is 11-12m with only 1.10% market share, but, still filling the blank of 2012 and indicating the extension of school bus product chain.
3. Compared with the same period of 2012, the biggest proportions of decline and increase are respectively 7-8m and 5-6m.
Views:2208

