China recreational vehicle sales decrease by 18% YOY in July 2022
August 31, 2022
Source: www.chinaspv.com
Influenced by the epidemic, the sales of recreational vehicles (RV) in July were 1,171 units, down by 11% MOM and 18% YOY; the total sales from January to July were 6,326 units, down by 13% YOY.
| |
2018 |
2019 |
2020 |
2021 |
2022 |
| Sales in July (units) |
883 |
870 |
965 |
1429 |
1171 |
| YOY growth in July |
88.0 |
-1.0 |
11.0 |
48.0 |
-18.0 |
| Total sales from Jan to Jul (units) |
4246 |
5744 |
4179 |
7261 |
6326 |
| YOY growth from Jan to Jul |
90.0 |
35.0 |
-27.0 |
74.0 |
-13.0 |
The year-on-year growth in July and the first seven months of 2022 were negative, which were mainly because of the epidemic from April to June and the extreme hot weather in July.
| |
Jan |
Feb |
Mar |
Apr |
May |
Jun |
Jul |
| Monthly sales in 2022 (units) |
1276 |
380 |
769 |
569 |
843 |
1318 |
1171 |
| Monthly sales in 2021 (units) |
935 |
411 |
720 |
1266 |
1013 |
1487 |
1429 |
| YOY growth % |
36.5 |
-7.5 |
6.8 |
-55.1 |
-16.8 |
-11.4 |
-18.0 |
| MOM growth % |
14.2 |
-56.0 |
102.4 |
-26.0 |
48.2 |
56.3 |
-11.2 |
Affected by the epidemic from April to July, the RV market witnessed sales decrease for four consecutive months, which is the main reason for the sluggish market this year.
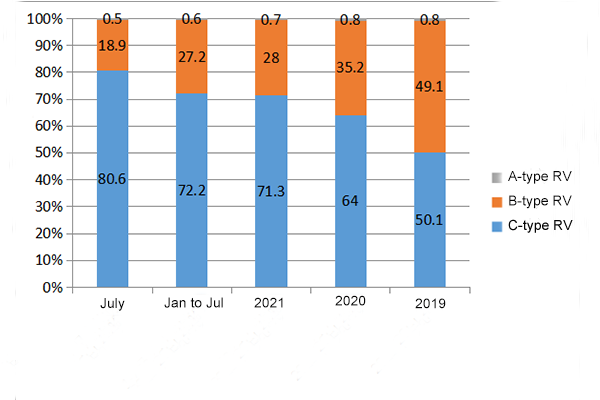
| |
C-type RV |
B-type RV |
A-type RV |
Total |
| Sales in July (units) |
944 |
221 |
6 |
1171 |
| Proportion of July % |
80.6 |
18.9 |
0.50 |
100.0 |
| Total sales from Jan to Jul (units) |
4569 |
1723 |
34 |
6326 |
| Proportion from Jan to July % |
72.2 |
27.2 |
0.6 |
100.0 |
| Proportion of 2021 % |
71.3 |
28.0 |
0.7 |
100.0 |
| Proportion of 2020 % |
64.0 |
35.2 |
0.8 |
100.0 |
| Proportion of 2019 % |
50.1 |
49.1 |
0.8 |
100.0 |
In recent years, C-type RV has dominated the market, which mainly because C-type RV is more economical and practical and can meet most customers’ needs.
In July 2022, the sales of RV less than 6m is 1,162 units, accounting for 99.23%; and the total sales from January to July is 6,286 units, accounting for 99.37%.
| |
Less than 6m |
6-8m |
Over 8m |
Total |
| Sales in July (units) |
1162 |
3 |
6 |
1171 |
| Proportion of July % |
99.23 |
0.256 |
0.512 |
100.0 |
| Total sales from Jan to Jul (units) |
6286 |
6 |
34 |
6326 |
| Proportion from Jan to July % |
99.37 |
0.095 |
0.5375 |
100.0 |
Whether in July this year or from January to July, SAIC Maxus and Yutong were both the champions and runners-up in the RV industry.
| Rank in July |
Company |
Sales in July (units) |
YOY growth in July % |
Proportion of July % |
Sales from Jan to Jul (units) |
YOY growth from Jan to Jul % |
Proportion from Jan to Jul % |
| 1 |
SAIC MAXUS |
234 |
6.0 |
19.98 |
916 |
18.0 |
14.48 |
| 2 |
Yutong |
145 |
-11.0 |
12.38 |
585 |
-17.0 |
9.25 |
| 3 |
Zhejiang Daide Longcui Auto |
84 |
-1.0 |
7.17 |
366 |
39.0 |
5.79 |
| 4 |
Hebei Livezone Special Vehicle |
61 |
56.0 |
5.21 |
337 |
111.0 |
5.33 |
| 5 |
Chery REV Special Vehicle |
39 |
-40.0 |
3.33 |
205 |
16.0 |
3.24 |
| 6 |
Chongqing Jinguan |
39 |
39.0 |
3.33 |
116 |
8.0 |
1.83 |
| 7 |
Shandong Kama |
32 |
Net growth |
2.73 |
138 |
Net growth |
2.18 |
| 8 |
Henan Xinfei |
29 |
-22.0 |
2.48 |
136 |
-24.0 |
2.15 |
| 9 |
Shandong Juvatuo |
29 |
53.0 |
2.48 |
104 |
49.0 |
1.64 |
| 10 |
Hubei Qixing |
29 |
7.0 |
2.48 |
224 |
136.0 |
3.54 |
| |
Industry |
1171 |
-18.0 |
100.0 |
6326 |
-13.0 |
100.0 |
Rank of the top 10 cities for RV sales in July and January-July 2022:
| Rank in July |
City |
Sales in July (units) |
Proportion of July % |
Sales from Jan to Jul (units) |
Proportion from Jan to July % |
Rank from Jan to July |
| 1 |
Changzhou |
67 |
5.72 |
214 |
3.38 |
3 |
| 2 |
Weihai |
56 |
5.12 |
224 |
3.54 |
2 |
| 3 |
Beijing |
51 |
4.36 |
246 |
3.89 |
1 |
| 4 |
Chengdu |
47 |
4.01 |
189 |
2.99 |
4 |
| 5 |
Zhengzhou |
46 |
3.93 |
169 |
2.67 |
5 |
| 6 |
Suzhou |
43 |
3.67 |
214 |
3.38 |
3 |
| 7 |
Nanjing |
29 |
2.48 |
159 |
2.51 |
6 |
| 8 |
Quzhou |
27 |
2.31 |
95 |
1.50 |
15 |
| 9 |
Shanghai |
27 |
2.31 |
154 |
2.43 |
7 |
| 10 |
Shenyang |
25 |
2.13 |
129 |
2.04 |
13 |
| |
China |
1171 |
100.0 |
6326 |
100.0 |
|